Population Graphs and Industry Maps of Certain States in the United States, 1940-01-01 - 1940-12-31
Scope and Contents
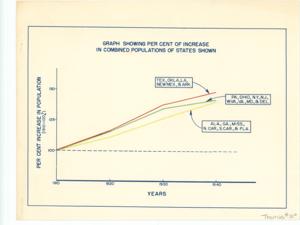
Create a concise and logical summary: This document, identified as CAC_CC_053_4_0000_1_111, features a series of graphs and maps analyzing economic and industrial growth, including percent increases in combined populations, manufacturing establishments, and state populations from circa 1940, as well as the strategic importance of the "Soo" and Panama Canals for iron and steel centers in east Texas, and foundries in the proposed east Texas market area. Dimensions: (a) 8 1/2" x 11", (b) 8 1/2" x 11", (c) 8 1/2" x 11" (3 pages), (d) 20" x 23 3/4", (e) 20 1/2" x 25 1/2".
Dates
- Creation: 1940-01-01 - 1940-12-31
Creator
- From the Collection: Thomas, Elmer, United States Senator from Oklahoma (1927-1951); U.S. House of Representatives from Oklahoma's 6th district (1923-1927); Member of the Oklahoma Senate (1907-1920), 1876-1965 (Person)
Language of Materials
English
Conditions Governing Access
Certain series of this collection are stored off-site and require prior notice to access. If you wish to view these materials, please contact the Congressional Archives staff to arrange an appointment.
The following series are stored off-site: Constituent Services, Miscellaneous, and Office Series.
Full Extent
1 pages
Abstract
76th (1939-1941)
Repository Details
Part of the Carl Albert Center Congressional and Political Collections Repository